
Market Breadth Just Collapsed: Is Smart Money Running For The Exits?
Something just snapped on Wall Street.
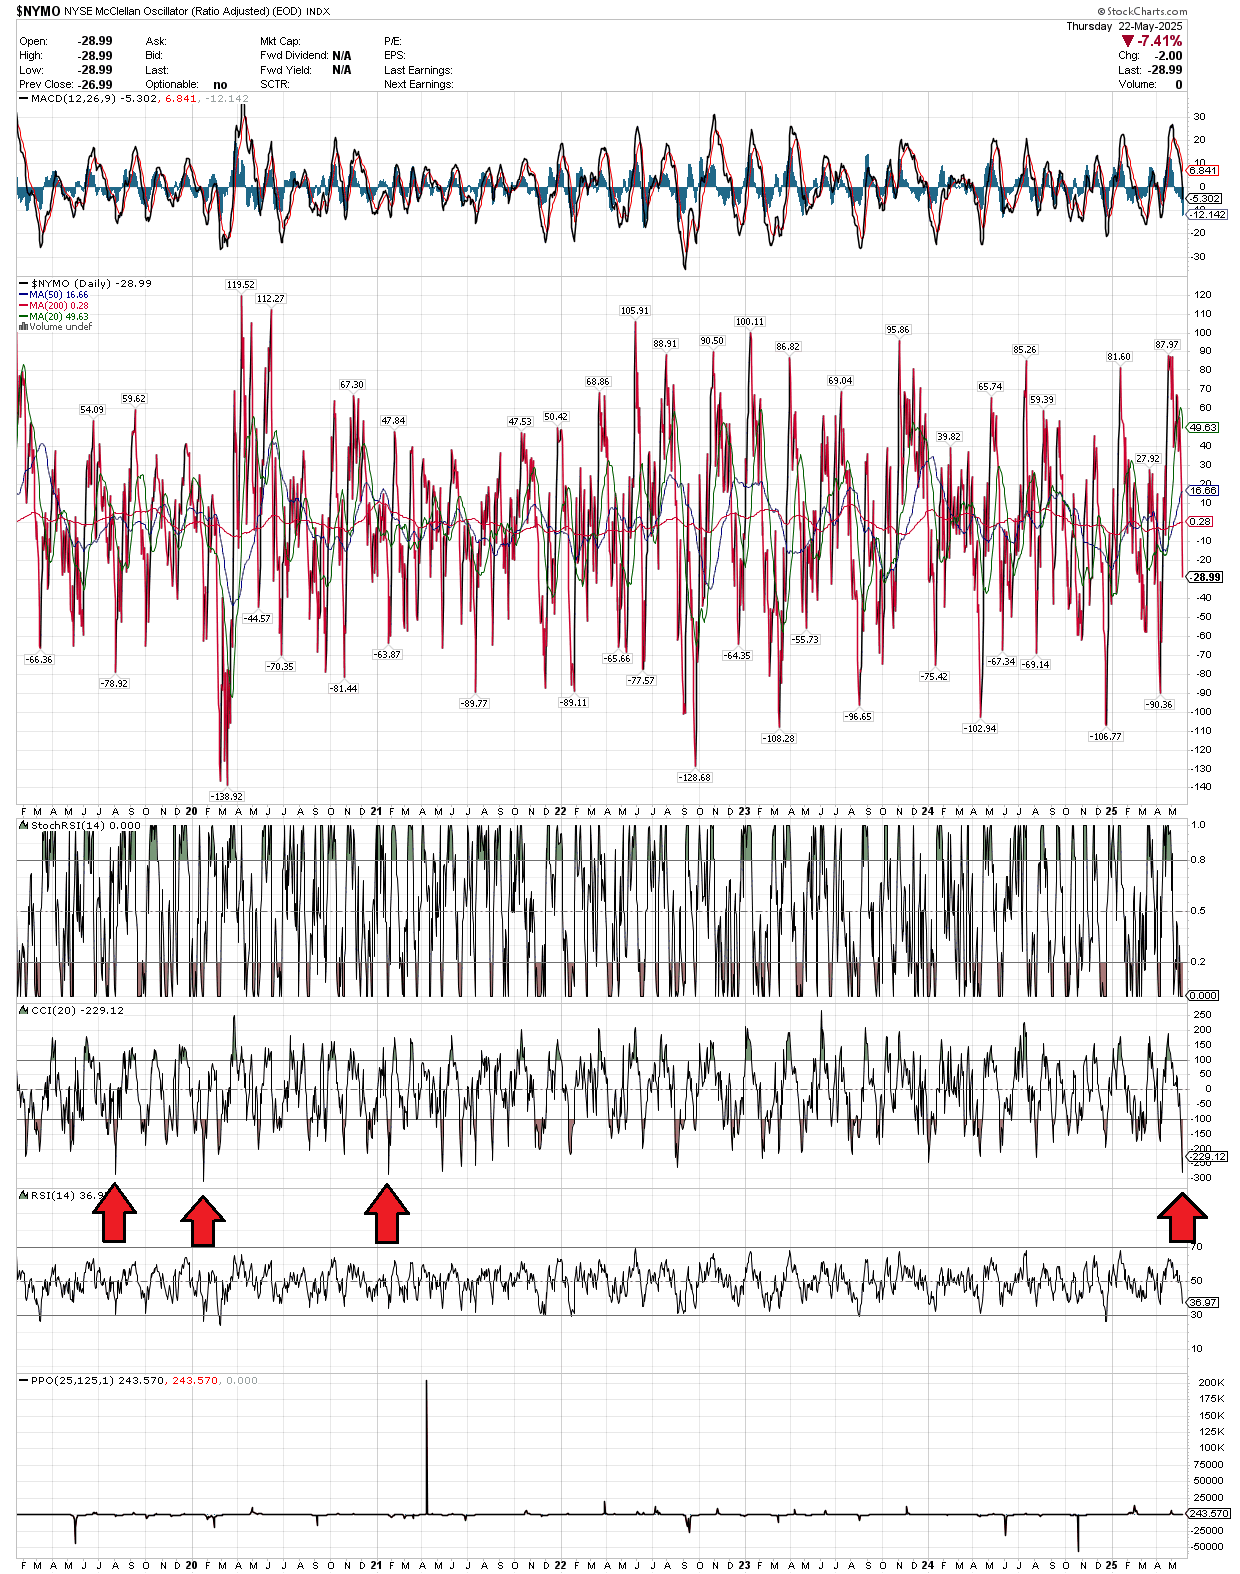
This week, a rarely watched but deeply revealing market signal lit up like a red alert: the Commodity Channel Index (CCI) applied to the NYSE McClellan Oscillator just posted its sharpest collapse since February 2020—yes, right before COVID chaos torpedoed markets worldwide.
So…?
You’ve probably never heard of the NYSE McClellan Oscillator ($NYMO). It’s not a stock. It’s not even a price chart. It’s a breadth indicator—a way of measuring the internal strength of the market.
It tracks the difference between the number of stocks going up versus those going down. When $NYMO is falling, it means more stocks are declining—sometimes a lot more—even if the index averages seem stable.
Now layer on the Commodity Channel Index (CCI). Usually used to gauge momentum in a single stock, here it’s being used to analyze the momentum of the market’s breadth. In other words: how fast are things falling apart under the hood?
This week’s CCI reading on $NYMO plunged to -229.12—a level we haven’t seen since early 2020. That means the decline in market breadth isn’t just happening—it’s accelerating hard.
📉 Translation?
This is a broad, violent sell-off, not just a few bad apples.
Red arrows on the chart mark previous moments when the CCI on $NYMO collapsed like this. Every time, it either preceded or coincided with sharp downturns in the broader market.
It’s not just price that matters—it’s participation. And right now, market participation is imploding.
If this kind of panic isn’t retail-driven, who’s selling?
‘Smart money’ always exits first.